ITAM
What is GLPI? Definition + 2026 Use Cases
GLPI explained for IT admins: definition, versions 11.0 vs 10.0, governance, real pricing, and when to migrate to modern SaaS alternatives.
16 min read
PC maintenance costs increase 59% between year 1 and year 4 (Wipro PSA / Intel). That number shouldn't surprise anyone in IT operations — and yet most IT leaders have zero data to measure it across their own fleet.
IT maintenance remains the neglected backbone of fleet management. 70% of organizations operate in fully reactive mode (Gartner, 2024). Average downtime costs exceed $300,000 per hour for midsize and large enterprises (ITIC, 2025). And preventive maintenance, when it exists at all, relies on fixed calendars rather than real device data.
This guide covers everything: definitions and types, real-world cost breakdowns, preventive vs. corrective trade-offs, an 8-task essential checklist, contract structure, and the method to shift from reactive to predictive — backed by fleet-level data.
TL;DR: PC maintenance costs rise 59% from year 1 to year 4 (Wipro PSA / Intel). Yet preventive maintenance cuts total costs by 12-18% vs. corrective-only, and predictive maintenance delivers up to 10:1 ROI (US DoE). This guide covers the three maintenance types, an 8-task essential checklist, contract structure, and the path from reactive to predictive — starting with real fleet data.
IT maintenance is the full set of actions designed to keep or restore IT systems to optimal working condition. It breaks down into three classic types — preventive (anticipate), corrective (repair), and evolutionary (upgrade) — plus a fourth, data-driven approach gaining ground fast: predictive maintenance.
Corrective maintenance happens after the failure. A laptop crashes, a hard drive dies, an OS refuses to boot. The IT team reacts. It's the most common approach — and the most expensive per incident.
Preventive maintenance happens before the failure. Scheduled updates, battery monitoring, disk health checks. The goal is to catch degradation early and act while costs are still low.
Evolutionary maintenance improves an existing system. RAM upgrade from 8 to 16 GB, SSD swap to replace a spinning drive, OS migration from Windows 10 to 11. It extends functional life without replacing the device.
Predictive maintenance — the emerging fourth type — goes further. Instead of following a fixed schedule, it uses real-time telemetry data (battery wear curves, S.M.A.R.T. disk metrics, thermal patterns) to forecast failures 3-6 months before they happen. It doesn't replace preventive maintenance. It makes it surgical.
The difference between internal and outsourced IT maintenance matters here too. A managed service provider (MSP) handles corrective and preventive tasks under contract. But outsourcing without fleet visibility means paying for maintenance on devices whose real condition nobody knows — including ghost devices that left the organization months ago.
PC maintenance costs rise 59% between year 1 and year 4 (Wipro PSA / Intel). For a 500-device fleet, maintenance represents 15-25% of the annual IT budget — and every hour of downtime costs an average of $300,000 for midsize and large enterprises (ITIC, 2025).
The Wipro/Intel cost curve tells a clear story. Year 1 is the baseline (index 100). Year 2 climbs to 118. Year 3 reaches 135. Year 4 hits 159. By year 5, the index approaches 180. A 5-year-old PC costs roughly 2x as much to maintain as a new one — the curve is not linear, it accelerates.
Downtime is the hidden multiplier. 90% of midsize and large enterprises report that one hour of downtime exceeds $300,000 (ITIC, 2025). For 41% of them, the figure climbs to $1-5 million per hour. The classic Gartner benchmark — $5,600 per minute — still holds as a reasonable floor.
Where does the money go? Typical IT maintenance spending breaks down into labor (helpdesk, on-site techs), parts (batteries, SSDs, RAM modules), licensing (extended security updates — Windows 10 ESU runs $61 per device per year), and the productivity loss during every incident. Most organizations undercount the last category.
One more factor to watch in 2026: the DRAM crisis. Memory prices have doubled over the past 18 months, driving PC prices up 17%. That means RAM upgrades — once a no-brainer Repair decision — now require tighter ROI scrutiny.
Real computer lifespan by brand — the actual numbersPC maintenance costs rise 59% from year 1 to year 4 (Wipro PSA / Intel). A 5-year-old PC costs roughly 2x what a new one costs to maintain — and every hour of unplanned downtime exceeds $300,000 for 90% of midsize and large enterprises (ITIC, 2025).
Preventive maintenance reduces total costs by 12-18% compared to a corrective-only approach. The recommended balance: 80% preventive, 20% corrective. But the real indicator is the ratio — not the volume.
The definitions are straightforward. Preventive maintenance is planned — actions taken before any failure occurs. Corrective maintenance is reactive — you fix what breaks, when it breaks. Every IT fleet needs both. The question is the proportion.
Emergency repairs cost 3-5x more than planned interventions. A battery replacement at 60% remaining capacity costs around $120. Waiting for the battery to die — then managing the emergency (loaner device, IT labor, lost productivity, rush shipping) — costs $500 or more. Multiply that across 50 battery failures per year on a 500-device fleet, and the math is brutal.
The 80/20 target is the industry standard for a reason. Below 70% preventive, you're absorbing too many emergency costs. Above 90% preventive, you're over-maintaining — replacing parts that still have useful life, burning budget on devices that don't need attention yet.
The over-maintenance trap is real. Replacing every battery at 3 years regardless of condition, swapping SSDs on a fixed cycle, re-imaging machines annually "just in case" — all of this looks disciplined but wastes resources. A battery at 82% capacity doesn't need replacement. A battery at 58% does.
When is corrective maintenance justified? Three cases: genuinely unpredictable failure (a rare motherboard fault), an obsolete part that no longer warrants repair investment, and end-of-life devices where any repair cost exceeds the 50% replacement threshold.
Complete battery health diagnostic for enterprise fleetsPredictive maintenance delivers up to 10:1 ROI (US Department of Energy). It reduces IT maintenance costs by 40%, cuts unplanned downtime by 30-45%, and extends equipment lifespan by 35%. The prerequisite: real device data.
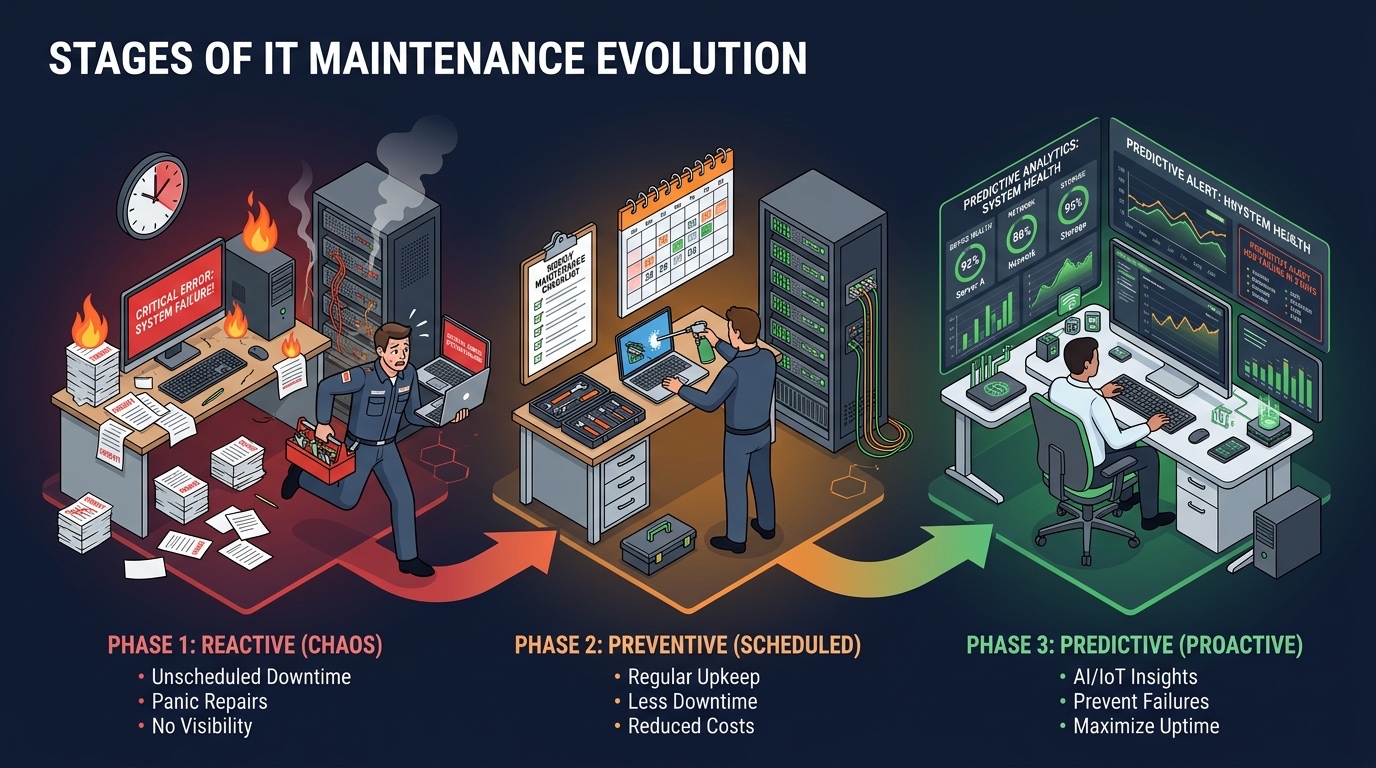
Not all organizations start from the same place. The path from reactive to predictive follows four distinct levels:
Level 1 — Reactive. You wait for the failure. A ticket comes in, a technician responds. 70% of organizations sit here (Gartner, 2024). It's the most expensive model per incident and the least predictable for budgeting.
Level 2 — Calendar-based. Fixed 3-4 year refresh cycles. Better than reactive, but it ignores device-level variance. Two identical laptops purchased the same day can be 30-40 points apart on a health score after 3 years.
Level 3 — Preventive. Scheduled checklists, periodic monitoring, threshold-based alerts. Good cost-to-efficiency ratio. Most organizations should aim here as a minimum.
Level 4 — Predictive. Real-time health scoring, automated alerts 3-6 months before failure, quarterly budget planning based on fleet data. The gold standard.
The gap between Level 1 and Level 4 is not tooling — it's data. You cannot predict what you don't measure. The first step toward predictive IT maintenance isn't buying an AI platform. It's building a complete IT asset inventory with real health scoring on every device.
sobrii's approach: a lightweight Rust endpoint agent collects 8 health dimensions per device (battery, storage, RAM, disk health, stability, boot config, warranty, age). These consolidate into Health, Performance, and Security scores. The K/R/R/R framework then assigns each device to Keep, Repair, Reallocate, or Replace — automatically.
On fleets monitored by sobrii, the shift to automated scoring revealed that 40% of devices flagged for replacement still had 2+ years of residual life. During an audit of Montpellier Metropole (7,000 devices), maintenance was 100% reactive. Scoring showed that 70% of the fleet didn't need replacement — including 15% that could be reallocated to less demanding roles.
The Keep, Repair, Reallocate, Replace decision frameworkPredictive maintenance delivers up to 10:1 ROI (US DoE), cuts maintenance costs by 40%, and reduces unplanned downtime by 30-45%. The prerequisite isn't software — it's a complete fleet inventory with real-time health data on every device. Without that foundation, prediction is guesswork.
An effective preventive maintenance checklist covers 8 tasks — from the simplest (OS updates) to the most strategic (fleet-wide health scoring). These are the 8 actions that extend fleet lifespan and reduce unplanned downtime.
1. OS updates and security patches. Frequency: monthly. Non-negotiable. Unpatched systems are the #1 attack vector. Windows 10 extended security updates now cost $61 per device per year — a growing incentive to plan Windows 11 migrations.
2. Battery monitoring. Alert threshold: 70% remaining capacity. Replacement trigger: 60%. A battery swap costs $80-150 versus $800-1,500 for a new device — that's a 10:1 ROI on every replacement (Dell / Lenovo, 2025). Always-docked laptops hide degradation until the user unplugs.
3. Disk cleanup and storage management. Alert at 85% utilization. A full drive degrades performance, blocks updates, and accelerates wear. Any device still running an HDD in 2026 has an instant bottleneck — an SSD upgrade at $50-80 transforms perceived speed.
4. S.M.A.R.T. data verification. Reallocated sectors, read errors, operating temperature. S.M.A.R.T. metrics are the earliest failure predictors for storage drives. An SSD with climbing error rates is a Replace candidate, not a Repair.
5. RAM and performance audit. Average utilization above 90% signals a bottleneck. Windows 11 consumes 4 GB at idle. 8 GB is the absolute minimum. 16 GB is the comfortable standard for 2026.
6. Physical cleaning (ventilation, dust removal). Thermal throttling from dust accumulation reduces performance by 20-30%. Annual internal cleaning on business laptops prevents silent degradation that no software can detect.
7. Security verification (TPM, Secure Boot, antivirus). TPM 2.0 (Source: Microsoft Learn) and Secure Boot are prerequisites for Windows 11. A device without TPM 2.0 carries an escalating security risk. Verify antivirus definitions are current and endpoint protection is active. This check also surfaces shadow IT devices that fall outside standard maintenance.
8. Global health scoring and K/R/R/R arbitration. The strategic task that ties it all together. Consolidate the 7 previous checks into Health, Performance, and Security scores. Each device gets a Keep, Repair, Reallocate, or Replace recommendation. This is the bridge between preventive maintenance and predictive fleet management.
Track every maintenance action per device with sobrii's maintenance logAn effective IT maintenance checklist isn't just tasks — it's tasks with measurable thresholds. Battery alert at 70%, replacement at 60%. RAM alert above 90%. More than 3 BSODs per month triggers Repair or Replace. Without thresholds, maintenance stays anecdotal.
An effective IT maintenance contract covers 5 pillars: scope, SLAs (response and resolution times), preventive-corrective split, reporting and KPIs, and reversibility clauses. The trap: signing a managed services contract without visibility into the actual condition of your fleet.
Pillar 1 — Scope. An exhaustive inventory of covered assets: hardware, software, networking equipment. Without this, you pay for ghost devices — machines that left the organization or were reassigned but still appear on the contract.
Pillar 2 — SLAs. Response Time Guarantee (RTG) and Resolution Time Guarantee define your provider's commitments. Specify them by criticality level: executive-level device down = 2-hour response, standard workstation = 8-hour response. Vague SLAs produce vague results.
Pillar 3 — Preventive-corrective ratio. The contract must specify the 80/20 target and list which preventive tasks are included. A contract that covers only break-fix is a corrective-only contract disguised as "maintenance."
Pillar 4 — Reporting and KPIs. Monthly reporting should include: ticket volume, MTTR (Mean Time to Resolution), fleet availability rate, and cost per device. Without KPIs, you can't evaluate whether the contract delivers value. A CMDB centralizes the configuration and maintenance data needed for this tracking.
Pillar 5 — Reversibility. Exit clauses, data transfer procedures, service continuity during transition. Vendor lock-in on IT maintenance creates long-term risk. Always negotiate reversibility before signing.
The blind outsourcing trap is common. Hiring a managed service provider without an accurate fleet inventory means paying for phantom devices. During sobrii audits, 10-15% of discovered devices were unknown to the IT department — and therefore outside any existing contract.
A contract negotiated with fleet-level health data produces better pricing and tighter SLAs. When you can show a provider that 35% of your fleet is in Keep status, 20% needs Repair, and 15% is due for Replace, the conversation shifts from hourly rates to outcome-based commitments.
Build the IT asset inventory that powers your maintenance contracts Explore sobrii's fleet management platformAn IT maintenance contract without fleet visibility is a blank check. The 5-pillar structure — scope, SLAs, preventive-corrective ratio, KPIs, and reversibility — ensures measurable accountability. But the real advantage is data: a provider who sees your fleet health scores gives you better terms.
Organizations that adopt data-driven IT maintenance see 20-30% savings on their annual hardware budget (Gartner, 2025). On a 500-device fleet, that translates to $48,000 per year. The audit of Montpellier Metropole (7,000 devices) revealed 2,800 devices that didn't need replacement.
Lever 1: avoided replacements. In a calendar-based refresh cycle, 30-40% of devices are still healthy when they're scheduled for replacement. On a 500-device fleet at $160,000 per year in refresh spending, that's $48,000-64,000 wasted on unnecessary replacements.
Lever 2: reduced downtime. Planned maintenance takes 30 minutes of transition per device. Emergency response averages 4-8 hours of lost productivity — not counting the stress, workarounds, and temporary equipment.
Lever 3: extended equipment lifespan. Predictive IT maintenance extends equipment life by 35% (US DoE). A fleet averaging 3.5 years of useful life extends to 4.7 years. Across 500 devices, that's 150 fewer replacements over a 5-year period.
Lever 4: environmental impact. Manufacturing a laptop generates 300+ kg of CO2 (Source: ADEME). Every avoided replacement preserves that carbon footprint. Extending average lifespan from 3 to 5 years reduces lifecycle emissions by 40%.
During the Montpellier Metropole audit, 40% of devices flagged for calendar-based replacement were still fully functional after scoring. That's 2,800 devices that didn't need replacing — and potential savings of several million dollars across the fleet lifecycle.
How the K/R/R/R framework drives replacement decisions Request a fleet audit — free scoring on 50 devicesData-driven IT maintenance produces 20-30% savings on hardware budgets (Gartner, 2025). The four levers: avoided replacements, reduced downtime, extended equipment lifespan (+35%), and measurable environmental impact (300+ kg CO2 per device saved). The math favors data at every fleet size.
Preventive maintenance is planned — scheduled actions taken before any failure occurs (updates, battery monitoring, health checks). Corrective maintenance is reactive — you fix what breaks, after it breaks. The optimal balance is 80% preventive, 20% corrective. Preventive maintenance reduces total costs by 12-18% compared to a corrective-only approach, and emergency repairs cost 3-5x more than planned interventions.
For a company with 100-500 devices, expect IT maintenance to represent 15-25% of the annual IT budget. Cost per device ranges from $180/year (healthy device in Keep status) to $320/year (device due for replacement). A data-driven approach reduces this budget by 20-30% — primarily by avoiding unnecessary replacements and shifting to planned interventions over emergency fixes.
It depends on fleet size, internal expertise, and risk tolerance. Managed service providers suit organizations without a dedicated IT team. But regardless of who performs the maintenance, fleet visibility is non-negotiable. Outsourcing without an accurate inventory means paying for phantom devices and receiving SLAs that no one can verify. Always maintain independent visibility over your fleet's real condition.
Monitor three key indicators: battery capacity (alert at 70%, replacement at 60%), RAM utilization (above 90% signals a bottleneck), and incident frequency (more than 3 BSODs per month triggers a Repair or Replace evaluation). Automated health scoring consolidates these into Health, Performance, and Security scores — removing guesswork from the decision.
Yes. The US Department of Energy reports ROI up to 10:1 from predictive maintenance programs. On a 100-device fleet, identifying just 10 avoidable replacements saves $10,000 per year. The prerequisite is lightweight monitoring — an endpoint agent that collects battery, disk, RAM, and stability data. The investment is minimal; the visibility is transformative.
IT maintenance is a data problem before it's a process problem. Here's what the numbers show:
The first step isn't a new contract or a new vendor. It's visibility. You cannot maintain what you cannot measure. An exhaustive fleet inventory with real-time health scoring on every device is the foundation everything else builds on.
Request a fleet audit — free scoring on 50 devices Explore the sobrii platformDiscover how sobrii transforms IT fleet management.
Book a demo